Interpolating a Function with Its Fourier Coefficients
It is often convenient to choose to work with a Fourier basis when modeling your data. If we write the Discrete Fourier Transform (DFT) as
\[\begin{equation} F_k = \sum_{n=0}^{N-1} f_n e^{-2 \pi i k \frac{n}{N}} \end{equation}\]
for \(k = 1 \ldots N\). Then we can get our original function back using the inverse DFT formula found in the Wikipedia article.
\[ \begin{equation} f_n = \frac{1}{N} \sum_{k=0}^{N-1} F_k e^{2 \pi i k \frac{n}{N}} \end{equation}\]
However this formula doesn’t allow us to interpolate our model between the timestamps of our measurements, \(t_n = \frac{n}{N}\) for \(n = 0, \ldots , N-1\).
To illustrate, we will consider samples taken from the function
\[f(t) = \begin{cases} t & 0 \le t < \frac{1}{2} \\ \frac{1}{t} - \frac{3}{2} & \frac{1}{2} \le t \le 1 \end{cases}\]
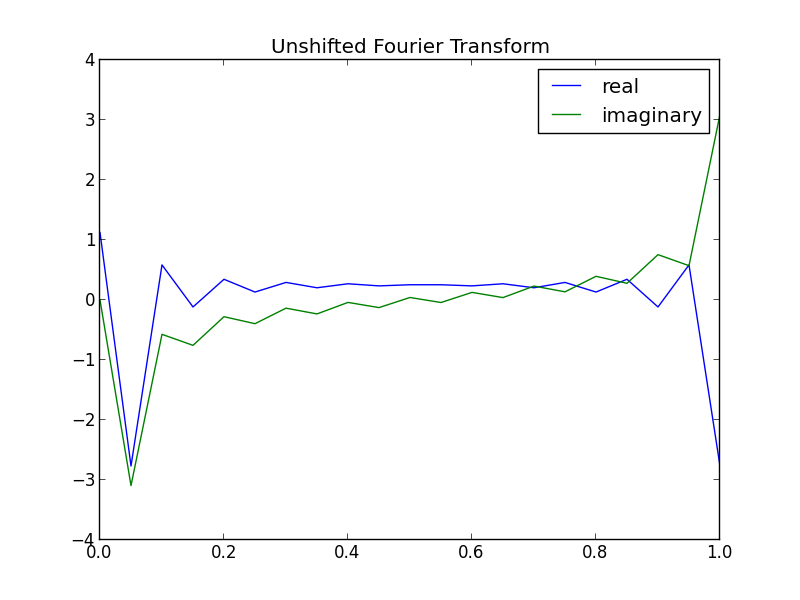
Whose Fourier Transform looks like

Note, this is the unshifted FFT, so the DC-term, or the coefficient corresponding to frequency zero, is at the beginning.
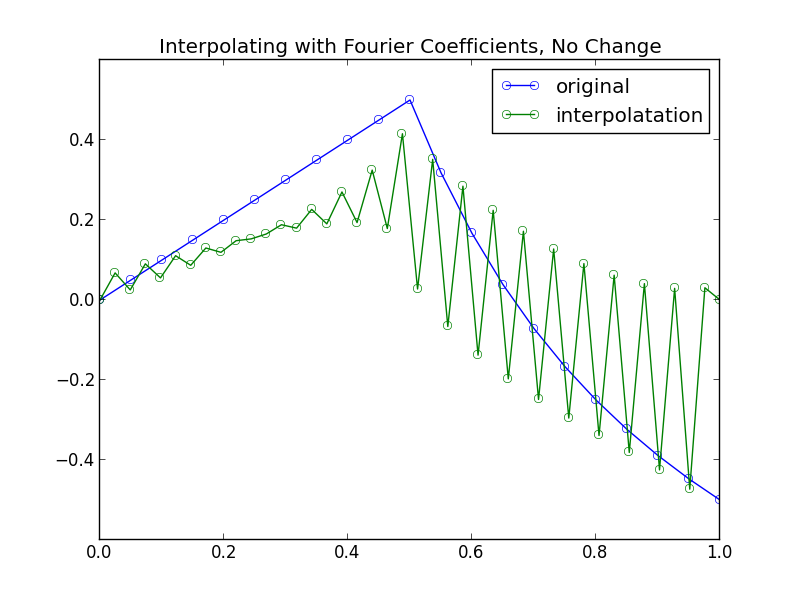
If we use formula (2), with the \(F_k\)’s in the above plot, to estimate \(f_n(t)\) for values of \(t\) in between our original samples we get the resulting plot:

So the question is, using the given \(F_k\)’s which we computed using a simple call to Numpy’s fft function, how can we estimate \(f(t)\) where \(t_0 \lt t \lt t_{N-1}\)?
The problem is a result of aliasing. The DFT has period \(N\)
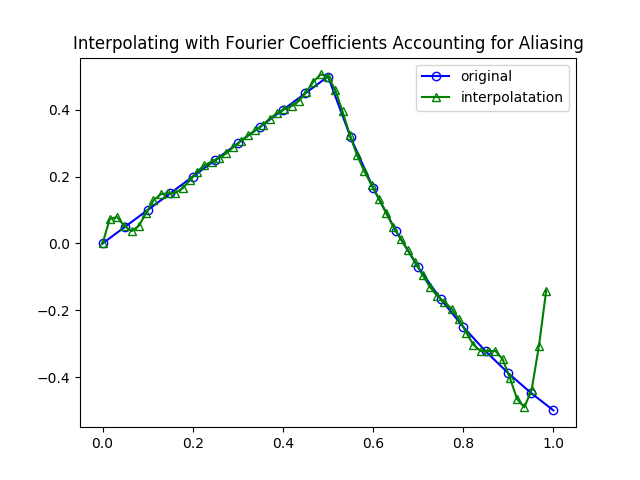
\[\begin{eqnarray*} F_{k+N} &=& \sum_{n=0}^{N-1} f_n e^{-2 \pi i (k+N) \frac{n}{N}} \\ &=& \sum_{n=0}^{N-1} f_n e^{-2 \pi i k \frac{n}{N}} e^{-2 \pi i n} \\ &=& \sum_{n=0}^{N-1} f_n e^{-2 \pi i k \frac{n}{N}} = F_k \end{eqnarray*}\]So the second half of the coefficients, \(F_{N/2}, \ldots , F_{N-1}\) correspond to the negative frequencies, \( -N/2, -N/2 + 1, \ldots , -1\). The solution then to our problem is to use the negative frequencies instead of the higher frequencies.
\[f_n =\frac{1}{N}\left[ \sum_{k=0}^{N/2-1} F_k e^{2 \pi i k t} + \sum_{k= N/2 }^{ N-1 } F_k e^{-2 \pi i (N-k) t} \right]\]
Note that using this formula depends upon the timestamps of the samples being scaled to be between 0 and 1.
Edit: We also require that the Fourier series be computed on all but the final sample of the original signal. The original post did not account for this and the interpolated values were skewed. This results from the Fourier series being periodic, but we were including a jump discontinuity at the end of our signal. I think adding some zero-padding to the original signal would also correct this issue, but I haven’t checked. I have also included a new plot with a truly periodic signal that begins and ends at the same value so that you can see the result without the ugly edge effects.

You can see the code that generated these plots here.