Graphical Solutions to First Order Dynamical Systems
Now that I have concluded my study of Fisher’s Complex Variables, I have changed directions slightly and begun reading Nonlinear Dynamics And Chaos by Steven Strogatz. This is my first deviation from a linear world. There everything can be broken down into smaller pieces and reassembled (think integrating over a sum of functions). This is not the case when linearity does not hold. This results in problems being much more difficult to solve. Often closed form, analytical answers are very difficult to come by, or impossible all together.
Take as a simple example the differential equation
\[\begin{equation} \dot{x}=\sin x \end{equation}\]where $x = x(t)$ and $\dot{x} = \frac{dx}{dt}$. To solve (1) analytically we separate variables and integrate
\[\begin{align*} \int \frac{dx}{\sin x} &= \int\,dt \\ \implies -\log\left|\csc x + \cot x\right| &= t + c \end{align*}\]If $x(0) = x_0$, then
\[c = \log\left| \csc x_0 + \cot x_0\right|\]and
\[\begin{equation} t = \log\left|\frac{\csc x_0 + \cot x_0}{\csc x + \cot x}\right| \end{equation}\]This is a closed from solution and it can be inverted to give us a better understanding of the long-term behavior of the solutions $x$ given an initial condition. Rearranging (2) we see,
\[\begin{equation} \frac{1+\cos x}{\sin x} = \left(\csc x_0 + \cot x_0\right)e^{-t} \end{equation}\]Then we make use of the double angle formulas
\[\begin{align*} 1 + \cos x &= 2 \cos^2(x/2)\\ \sin x &= 2 \sin \left(x/2\right) \cos \left(x/2\right) \end{align*}\]So that (3) becomes
\[\cot(x/2) = \left(\csc x_0 + \cot x_0\right)e^{-t}\]and finally,
\[\begin{equation} x = 2 \cot^{-1} \left(\left(\csc x_0 + \cot x_0\right)e^{-t}\right) \end{equation}\]Remember, that this is one of the simplest examples of a non-linear differential equation. We were able to separate variables and integrate. Most non-linear problems will not even be this “easy”.
Another Approach
Instead of the long calculation done above leading to the closed form solution (4), we could try to look at this problem from a geometric point of view. We start with (1), but this time we view the differential equation as a vector field over a line (the $x$-axis). In this way, we can plot the phase-diagram for the equation (1).

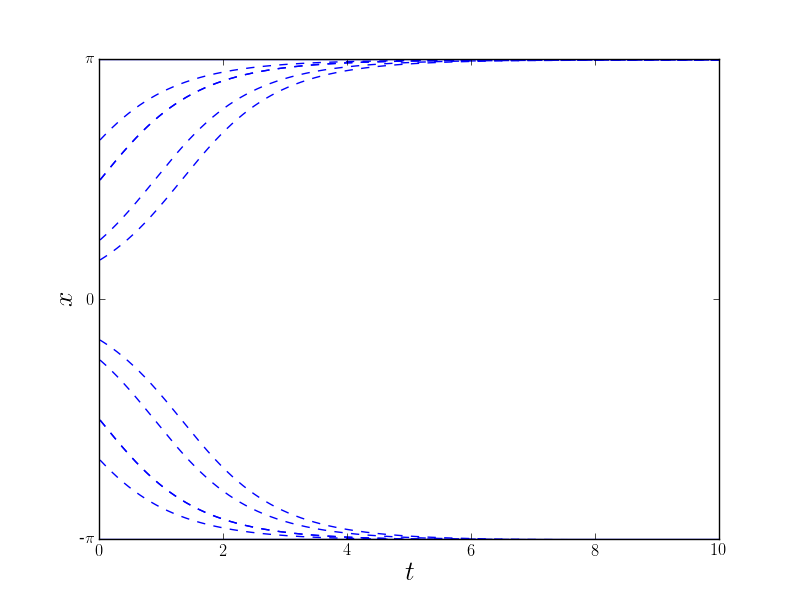
In the plot, we imagine a phase particle on the line with velocity $\dot{x}$. When the graph is above the $x$-axis the particle is moving to the right and when it is below the axis it moves to the left. We see several points in which the velocity of the flow is zero. These are called fixed points and two basic kinds are exhibited in the figure above. The fixed points that are filled in are known as stable, this is where the velocity of the flow is zero and the flow is toward these points (indicated by the arrows on the $x$-axis). The other kind of fixed-point in the plot above is $unstable$. These are where the flow is zero at the point but a small perturbation away from equilibrium leads the particle far away from it. In this way, we can immediately gain qualitative information about the solutions to (1). For instance, we see that if a particle starts at $x_0 = \pi/4$ it moves to the right speeding up until it reaches $x=\pi/2$ at which point it continues to move to the right but now the velocity is decreasing. It continues moving to the right until it reaches the stable-fixed point $x=\pi$, where it settles in.
We can also plot what the solutions, $x(t)$ look like by picking an initial $x_0$ and following the particle as it moves in the flow, similar to how we did above. We can then look at different initial conditions to find different paths the particle can take.

Note, that all of this information (and more) is available in the analytic solution (4), however, this graphical solution is much simpler and in several cases, an analytic solution is impossible. Furthermore, most of the information that is usually of interest is available in this graphical solution.
Linear Stability Analysis
Now we make one final observation in this post regarding an analytic method for determining the stability of a fixed point. To begin, let $ x_1$ be a fixed point of the system, $\dot{x} = f(x)$ and $\eta(t) = x(t) - x_1$ a small perturbation from $ x_1$. Recall that for a stable fixed point, this perturbation will decay leading back to $ x_1$, if $ x_1$ is unstable the perturbation will grow and lead the phase particle far away from $ x_1$. To decide whether $\eta$ will grow or decay we form a differential equation involving $\eta$. Differentiating the expression for $\eta$ leads to
\[\dot{\eta} = \frac{d}{dt}\left(x - x_1\right) = \dot{x}\]Thus,
\[\dot{\eta} = \dot{x} = f(x) = f( x_1 + \eta)\]Then we can look at the Taylor expansion for this final term
\[f( x_1 + \eta) = f( x_1) + \eta f'( x_1) + O(\eta^2)\]Where, $O(\eta^2)$ are terms quadratic in the perturbation $\eta$. Since $ x_1$ is a fixed point, $f( x_1)=0$. Then,
\[\dot{\eta} = \eta f'( x_1) + O(\eta^2)\]If $f’( x_1) \neq 0$ then the $O(\eta^2)$ is negligible and we have established the linearization of $\eta$.
\[\begin{equation} \dot{\eta} = \eta f'( x_1) \end{equation}\]This is a first order linear differential equation to which we know the solutions. Indeed, if $f’( x_1) \lt 0$ the perturbations will tend to zero, and if $f’( x_1) \gt 0$ the perturbations will grow.
Looking back at the example (1) notice that all the stable fixed points happen where $\frac{d}{dx} \sin x \lt 0$ and unstable ones happen where $\frac{d}{dx} \sin x \gt 0$.